In today’s visual-first online world, infographics are a powerful way to boost your blog’s engagement, increase time-on-page, and improve SEO. But if you’re just starting out and don’t have a design background or budget for premium tools, don’t worry.
In this guide, we’ll walk you through the 10 best free tools for creating infographics, specially curated for beginner bloggers. These tools are easy to use, require zero design experience, and help you create eye-catching graphics that make your content more shareable and readable.
Let’s dive right in!
Why Infographics Matter for Bloggers
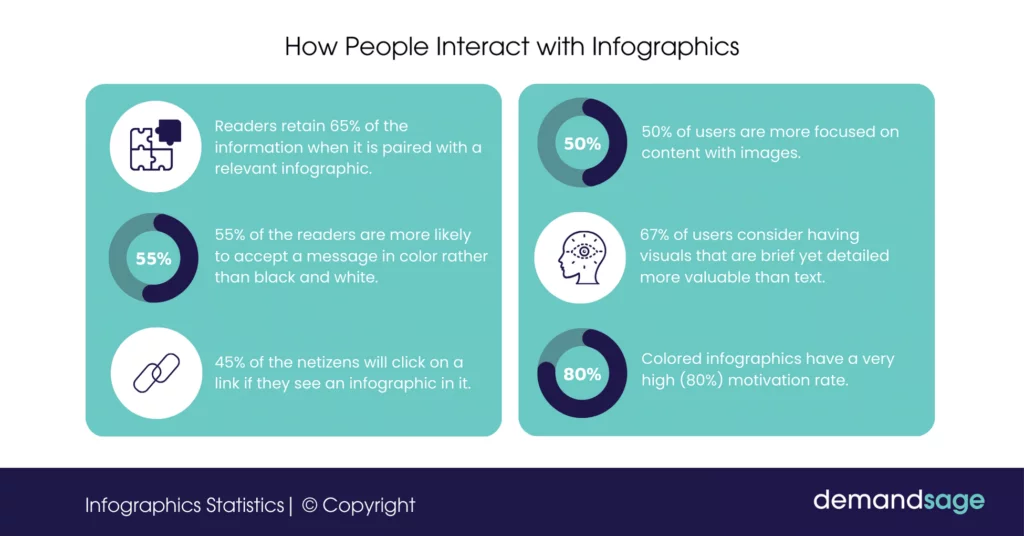
Infographics combine visuals + information to tell stories more effectively than text alone. Here’s why you should use them:
- Boost user engagement: People process visuals 60,000x faster than text.
- Improve SEO: Infographics attract backlinks, which help your posts rank.
- Drive social shares: Posts with infographics get more shares on platforms like Pinterest, Facebook, and X.
- Enhance readability: They help break up long blocks of text and improve flow.
10 Best Free Tools for Creating Infographics for Blog Posts
Here are the top tools we recommend for beginner bloggers, all of which offer generous free plans:
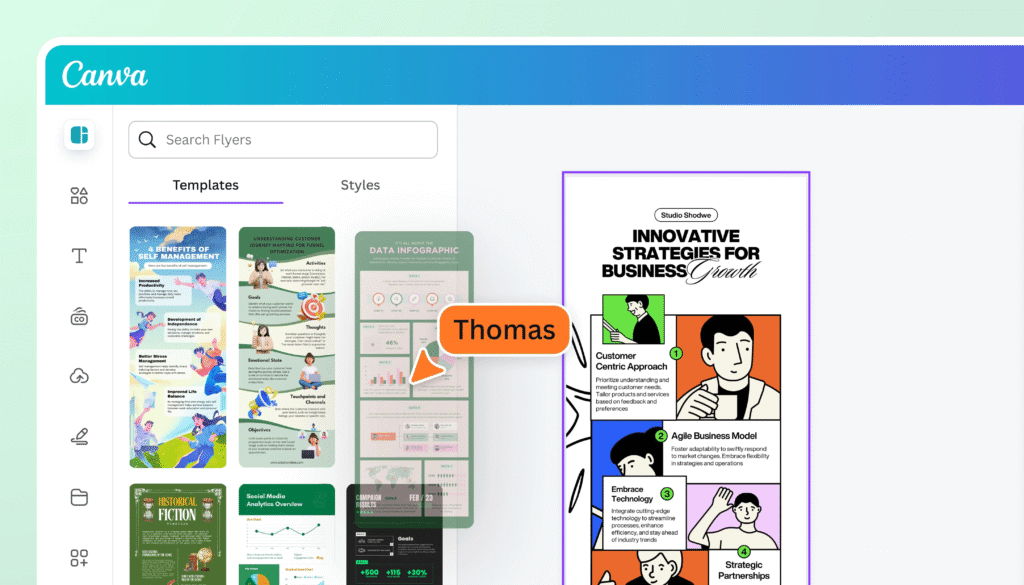
1. Canva
Best for: Beginners looking for drag-and-drop simplicity.
Why it’s great: Canva offers thousands of infographic templates, icons, charts, and text styles. You can create everything from timelines to comparison charts without design skills.
Features:
- Free infographic templates
- Drag-and-drop interface
- Export as PNG or PDF
- Huge library of icons and illustrations
Free plan limitations: Some premium templates and images are locked.
Website: https://www.canva.com
2. Piktochart
Best for: Creating detailed, professional-style infographics.
Why it’s great: Piktochart is tailored for data visualization with charts, maps, and report-like infographics that look polished.
Features:
- Smart chart builder
- Map visualizations
- Collaboration features
- Ready-made infographic layouts
Free plan limitations: Limited exports and templates.
Website: https://piktochart.com
3. Venngage
Best for: Data-heavy blog content that needs visual storytelling.
Why it’s great: With over 1,000 templates, Venngage makes it easy to visualize stats, timelines, and processes.
Features:
- Custom charts and diagrams
- Free drag-and-drop builder
- Access to stock photos and icons
- Brand kit options
Free plan limitations: Branding on free designs.
Website: https://venngage.com
4. Adobe Express (formerly Spark)
Best for: Bloggers who love clean, professional designs.
Why it’s great: Adobe Express offers beautiful templates and integrates with Adobe fonts and stock libraries.
Features:
- Stylish templates
- Custom size options
- Desktop and mobile-friendly
- Cloud saving
Free plan limitations: Limited fonts and templates.
Website: https://express.adobe.com
5. Visme
Best for: Bloggers who need interactive infographics.
Why it’s great: Visme lets you create animated, clickable infographics that you can embed in blog posts.
Features:
- Interactive features
- Charts and maps
- Tons of design elements
- Branding tools
Free plan limitations: Watermarked exports.
Website: https://www.visme.co
6. Infogram
Best for: Data bloggers and those using live statistics.
Why it’s great: Infogram lets you create dynamic, real-time data visuals from spreadsheets.
Features:
- Live data integration
- Over 35 chart types
- Embed support
- Interactive widgets
Free plan limitations: Limited projects and export options.
Website: https://infogram.com

7. Snappa
Best for: Quick and simple infographic creation with social media support.
Why it’s great: Snappa has a friendly UI, perfect for bloggers who want to create visual content quickly.
Features:
- Pre-sized for blogs and social media
- Simple UI
- Free graphics and text overlays
- One-click image download
Free plan limitations: Limited templates and 3 downloads/month.
Website: https://snappa.com
8. Easel.ly
Best for: Educational-style infographics with cartoons or diagrams.
Why it’s great: This tool makes it fun to create informative graphics, ideal for list posts and tutorials.
Features:
- Templates by category (education, business, etc.)
- Custom icon sets
- Drag-and-drop interface
Free plan limitations: Limited template access.
Website: https://www.easel.ly
9. Animaker
Best for: Bloggers who want animated infographics or videos.
Why it’s great: Animaker allows you to mix infographic data with animations or explainer-style visuals.
Features:
- Animated scenes
- Data + motion elements
- Video infographic capability
Free plan limitations: Watermarked exports.
Website: https://www.animaker.com
10. Mind the Graph
Best for: Science and education bloggers.
Why it’s great: Offers scientific-style visuals, illustrations, and infographic templates made for technical content.
Features:
- Medical/science illustrations
- Presentation support
- Infographic builder
Free plan limitations: Fewer downloads and watermarks.
Website: https://mindthegraph.com
How to Choose the Right Infographic Tool (as a Beginner)
Choosing the right tool depends on:
1. Your blog niche:
Educational or data-driven blogs = Piktochart / Venngage
Lifestyle or travel = Canva / Snappa
2. Type of infographic:
Want charts and maps? Go for Infogram or Visme.
Want social-friendly graphics? Canva or Snappa work best.
3. Export needs:
Need to embed? Pick Visme or Infogram.
Want static images? Canva and Snappa are perfect.
Tips for Creating Effective Blog Infographics
- Stick to one message per infographic
- Use your blog’s brand colors
- Don’t overdo text — less is more
- Use readable fonts and consistent icon styles
- Include your blog’s logo or URL
Where to Use Infographics in Your Blog Posts
- Inside tutorials or step-by-step guides
- To summarize long-form content
- In “How-to” or “list” articles
- In social media previews of your posts
- Inside downloadable lead magnets or PDFs
SEO Tips for Infographics
Don’t forget these important SEO strategies:
- Use descriptive alt text with keywords
- Add keywords in the file name (e.g.,
blog-infographic-tools.png) - Host infographics on your own domain for backlink potential
- Include a written explanation below the image
- Share on Pinterest and Google Images
FAQ – Infographic Tools for Blogging
Yes! You can either upload images directly or embed code (like from Visme or Infogram) inside the Gutenberg block editor.
Focus on visual appeal, helpful info, and a strong title. Promote on Pinterest, Twitter, and forums to boost reach.
Conclusion: Start Creating Stunning Blog Infographics Today
If you’re a beginner blogger, infographics are your secret weapon to stand out in a crowded content space. The tools we’ve covered — from Canva to Venngage to Piktochart — make it simple to design infographics that look professional and drive real traffic.
Start with just one tool, practice with a simple infographic for your next post, and watch your blog engagement grow!